This morning I ramped up the sucrose dose to 54 g dissolved in water, let’s see how it goes.
As some context: Before the lockdown I bought smaller sugar cubes (which are actually discs instead of cubes) that come in at 3 g each, making it 12 cubes to get to the prior level of 36 g.
So I went with using 18 of those cubes, adding 50% of sucrose to the prior testing. I’ll keep you posted how it goes!
Cool. I’m running my last oat-fiber test today. 25 and 100g both showed negligible BG impact. Today, I’m trying it baked for 18 min. at 350 F (typical cooking time/temp) to see if that changes anything (e.g. breaks down fibers to make them more digestible). After that, I’ll move onto whey protein, then a fat source.
On other good news, from my post on the Hot Shower Effect, I had a few people reach out who are interested in participating in this study. We’ll see if it pans out, but we should probably start thinking about how to aggregate the data everyone’s collecting.
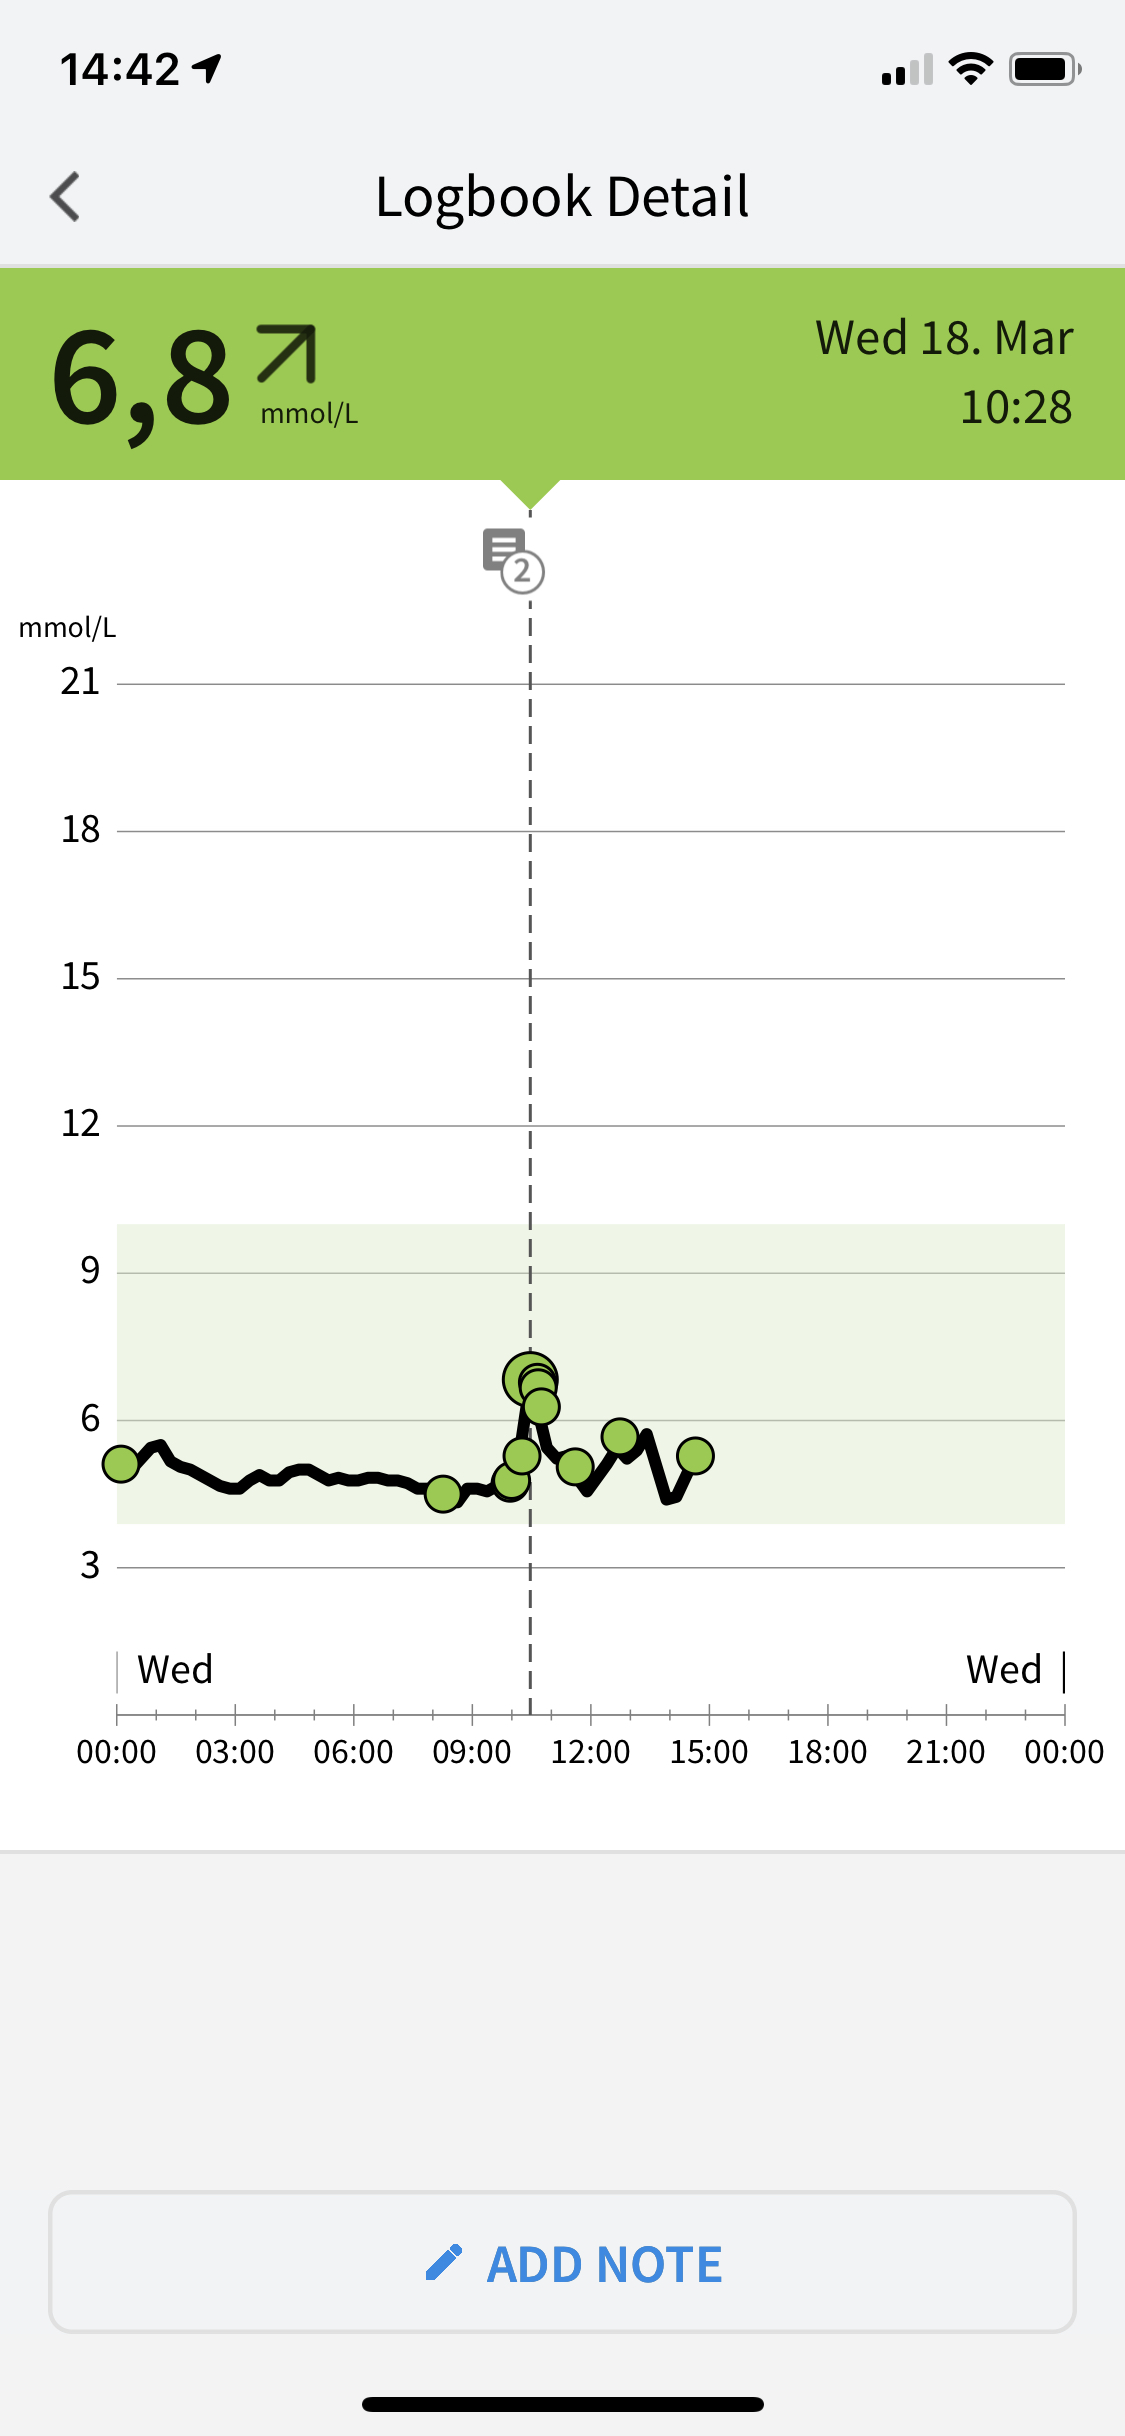
The general trend holds, back to normal within an hour. The peak this time seemed to be a bit lower than I’d have expected, with recorded values not getting above 7. But I wonder whether that’s an artifact of my libre readouts, as I recorded two 6.8 in a 15 minute range, but the first one was still classified as rising, so maybe the actual peak did get above 7, but I missed the data in the averaging and not having spot readouts.
Either way, I’ll try the same thing tomorrow again
I haven’t done any detailed analysis of my own data yet, but so far my workflow has been to note down the amounts of sugar in the Freestyle app on my phone when drinking the solution and also making a note of what I took. You can export those data as a CSV from the Freestyle website. If we can get people to follow a standardized note-format that would be the easiest, as people can then just share the whole CSV.
Here’s this mornings result, again doing 54 g of sucrose. This time the peak is a good bit higher and this is more what I’d personally have expected for yesterday as well. I’ll repeat the same thing once again tomorrow to see how it performs.
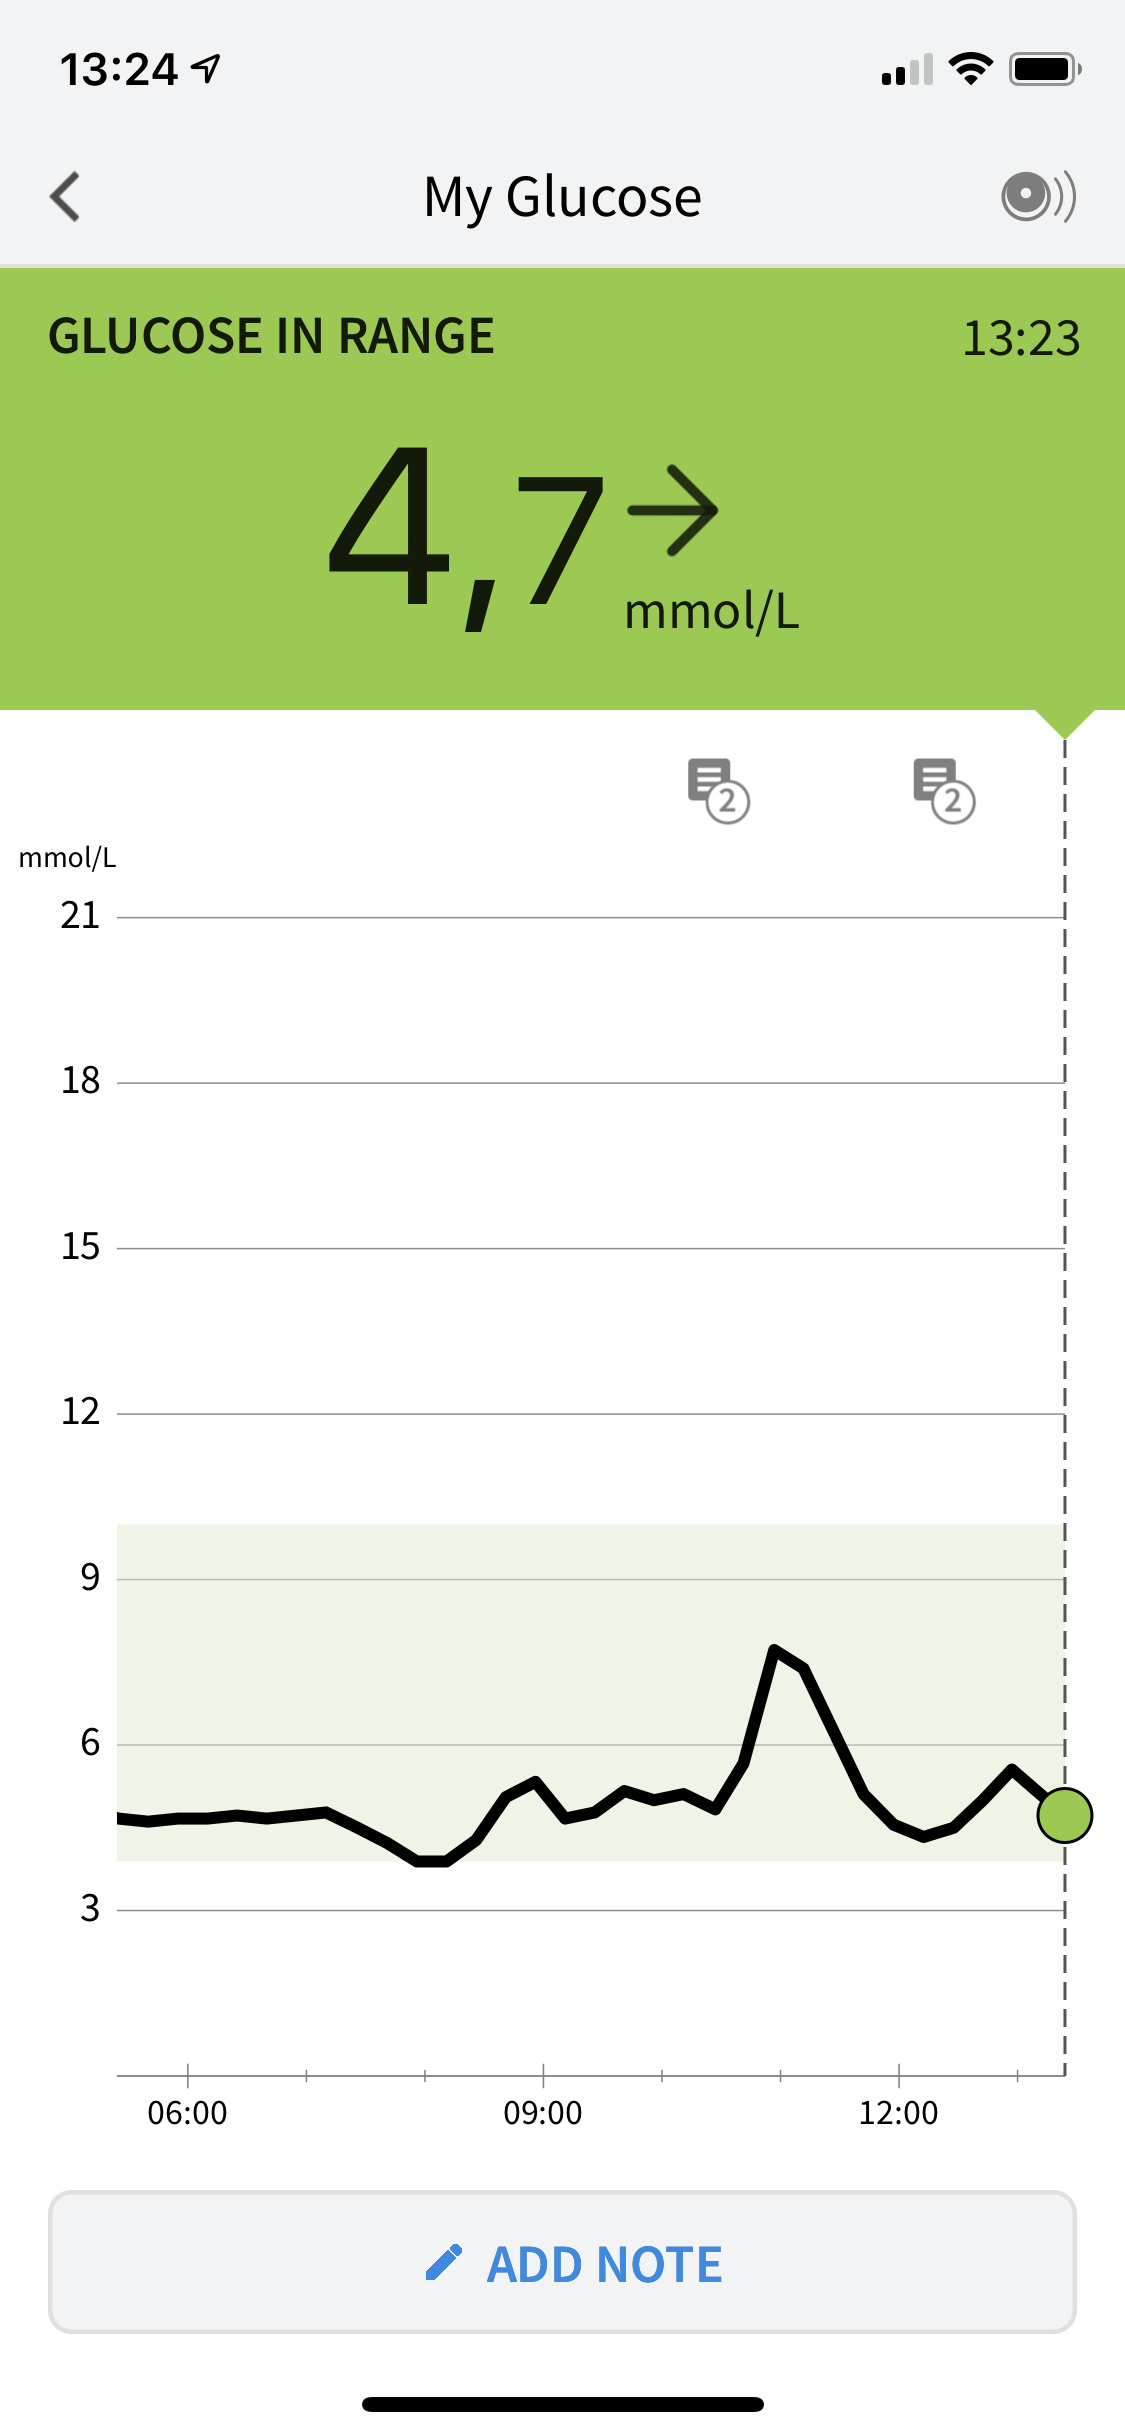
I think today might have been a clearer signal as I literally sat down, drank the solution and then kept sitting at my desk for the next 1h+ without any movement. So I should try to keep doing that
Very cool. I did cooked oat fiber yesterday. Same null response as the uncooked fiber (very slightly higher, but well within the noise of the meter), also very unpleasant to drink. Works much better in cookies and muffins .
Tomorrow I start testing whey protein. I’m really interested to see how the time trace of that compares with glucose, should be a lot more spread out. I also ordered a hydrogen breath tester so I can start measuring when/where food is being digested. I’ve noticed that when I overeat, my bloodsugar spikes many hours later while I’m sleeping. I’d like to figure out if that’s because my body is taking longer to digest the food, increased glycogen release by the liver, or something else. Also curious to find out for the “indigestible” fibers, whether they’re being digested in my large intestine or not.
That’s so interesting, I wonder whether this could explain my suspected ‘shower’ glucose increase. Didn’t get a chance to reproduce yesterday unfortunately. Will try tonight!
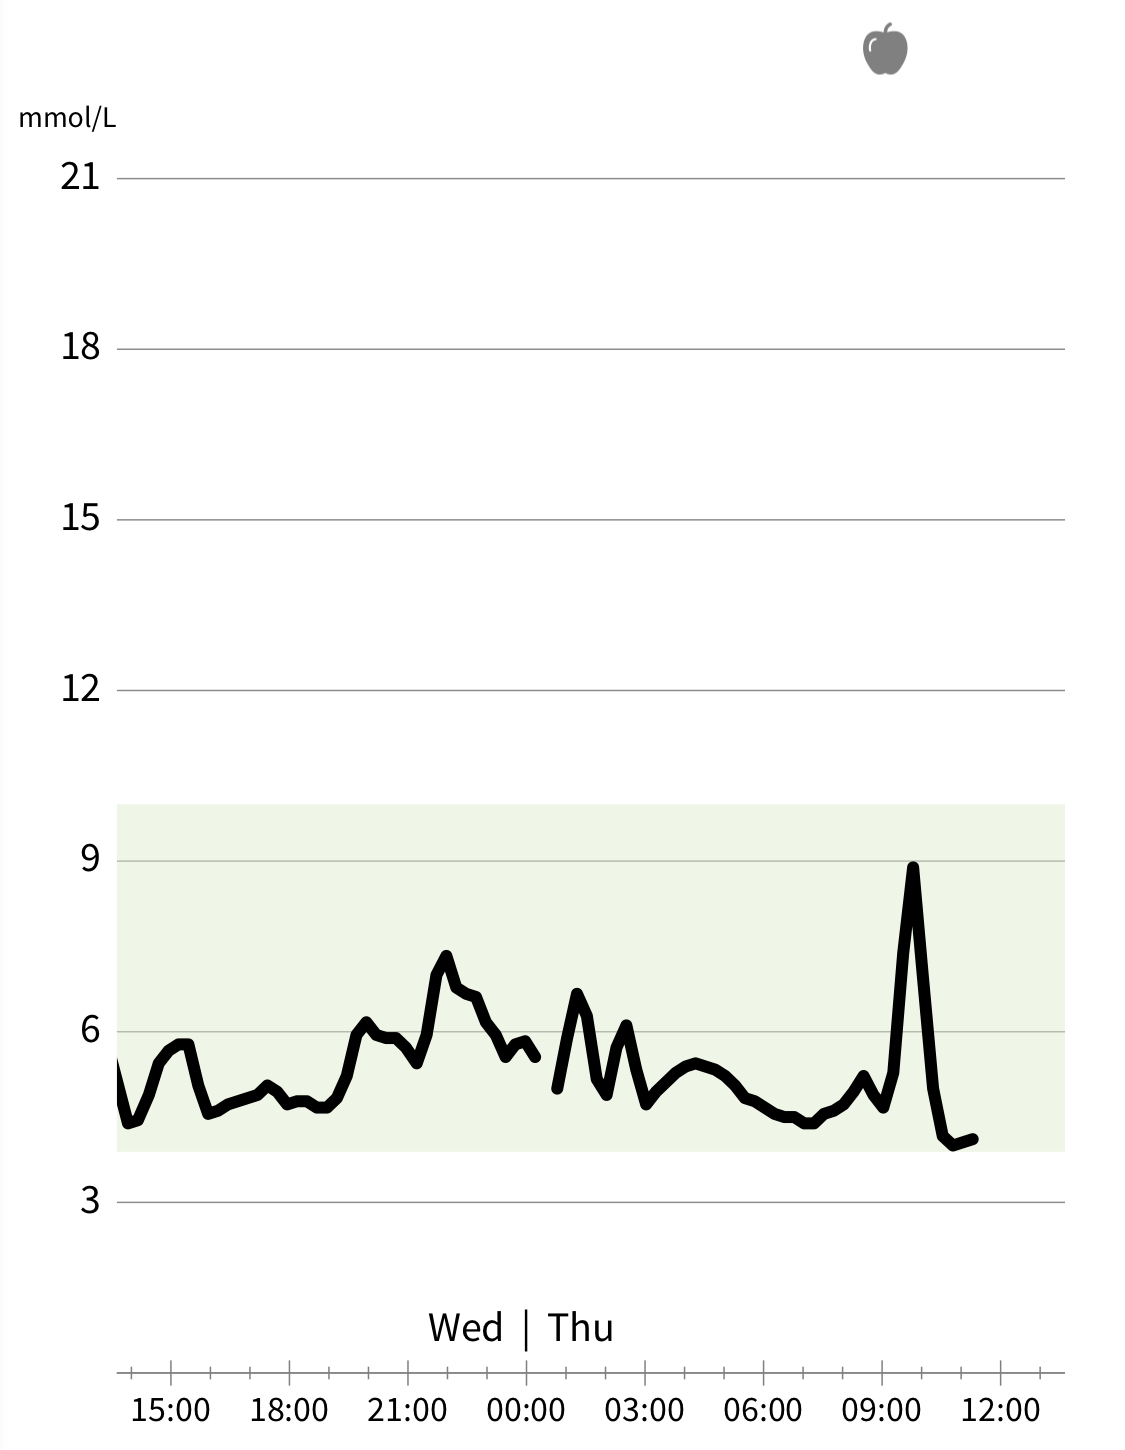
And here’s the next 54 g of sucrose (the first annotated peak of the day), somewhere in between the values for iteration 1 & 2. The second annotated peak is the result of eating 4 Haribo Dragibus
My back-of-the-envelope calculation was that those 4 should be somewhere at ~15 grams of sugar and the peak compares nicely to the 54 grams sucrose peak
Very interesting. I built a spreadsheet I’m using to calculate peak BG and incremental area under the curve vs. food amount. Any interest in adding your data to it? Then we could compare your sugar sensitivity to mine (and the rest of the effects as we accumulate more data.
I’d be happy to do that! I just wrapped up my 14 days with the Freestyle Libre and got 9 data points, 3 repeats each for 36, 54 and 72 grams of sucrose. Let me extract those data within the next days and then I can add them to your sheet!
Hey @skaye,
I just got my data from LibreView and was wondering whether you have a script that automates filling in the data in your spreadsheet or whether you’re doing this manually? As doing it manually seems a lot of work
For my spreadsheet, I’m using data from my blood glucose meter, not the libre. I record that with a python app I wrote using Pythonista, which saves to a spreadsheet that I can copy/paste from.
To process libre data for another study, I’m using a jupyter notebook I wrote. You can probably modify that pretty easily to put it in the same form as my spreadsheet. Here’s the link to the jupyter notebook (it’s got some code to compare the BGM and CGM data which you can delete): https://www.dropbox.com/s/lno6qzn48bmx46e/processLibreData.ipynb?dl=0


