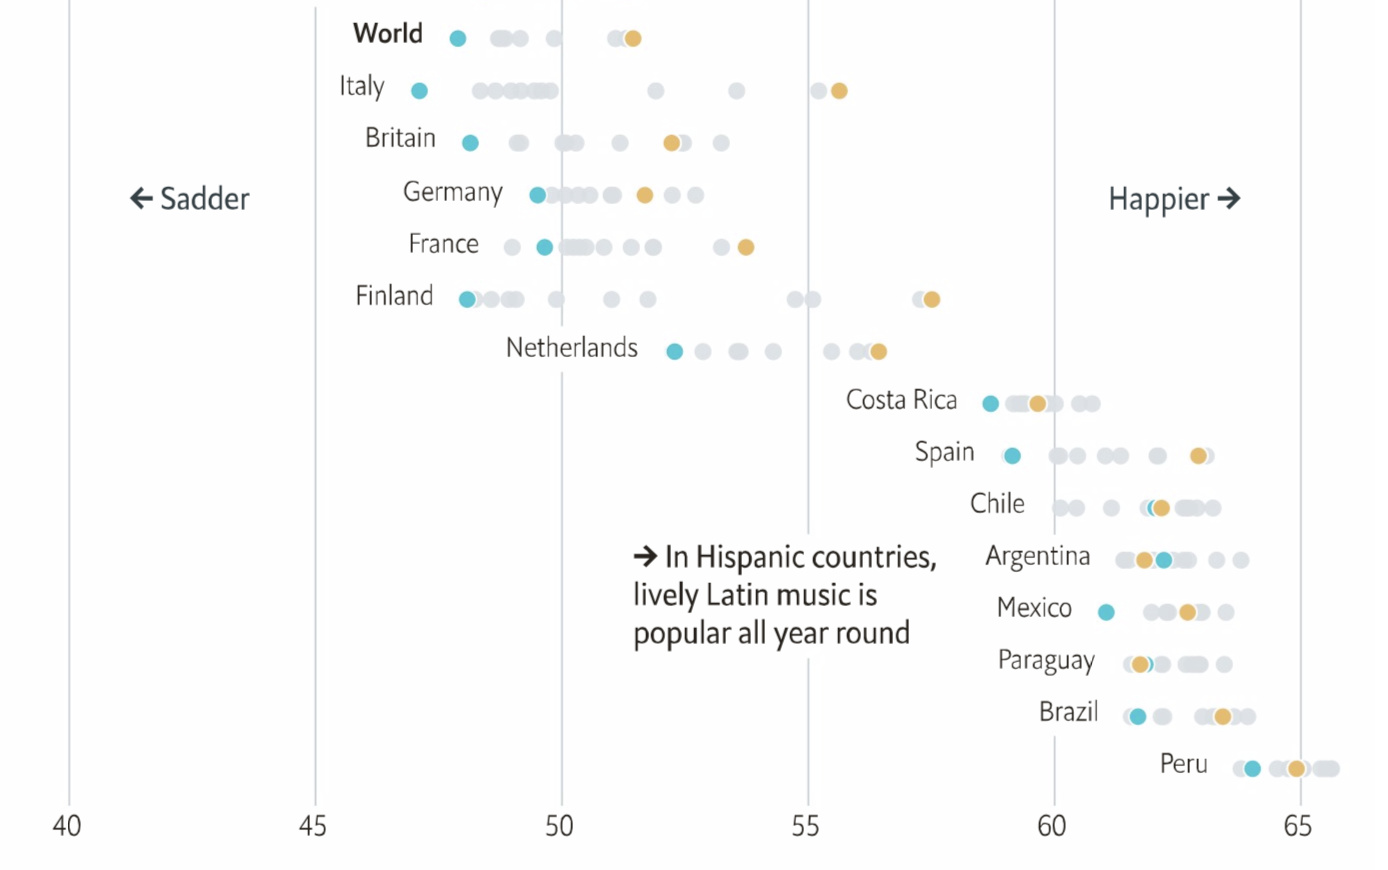
As I’ve been using the Spotify Connection for Open Humans for a long while I thought it should be easy to reproduce these findings for myself, as it also stores the valence (the fancy word for mood that Spotify uses) for each song I listen too! So I went ahead and looked into it!
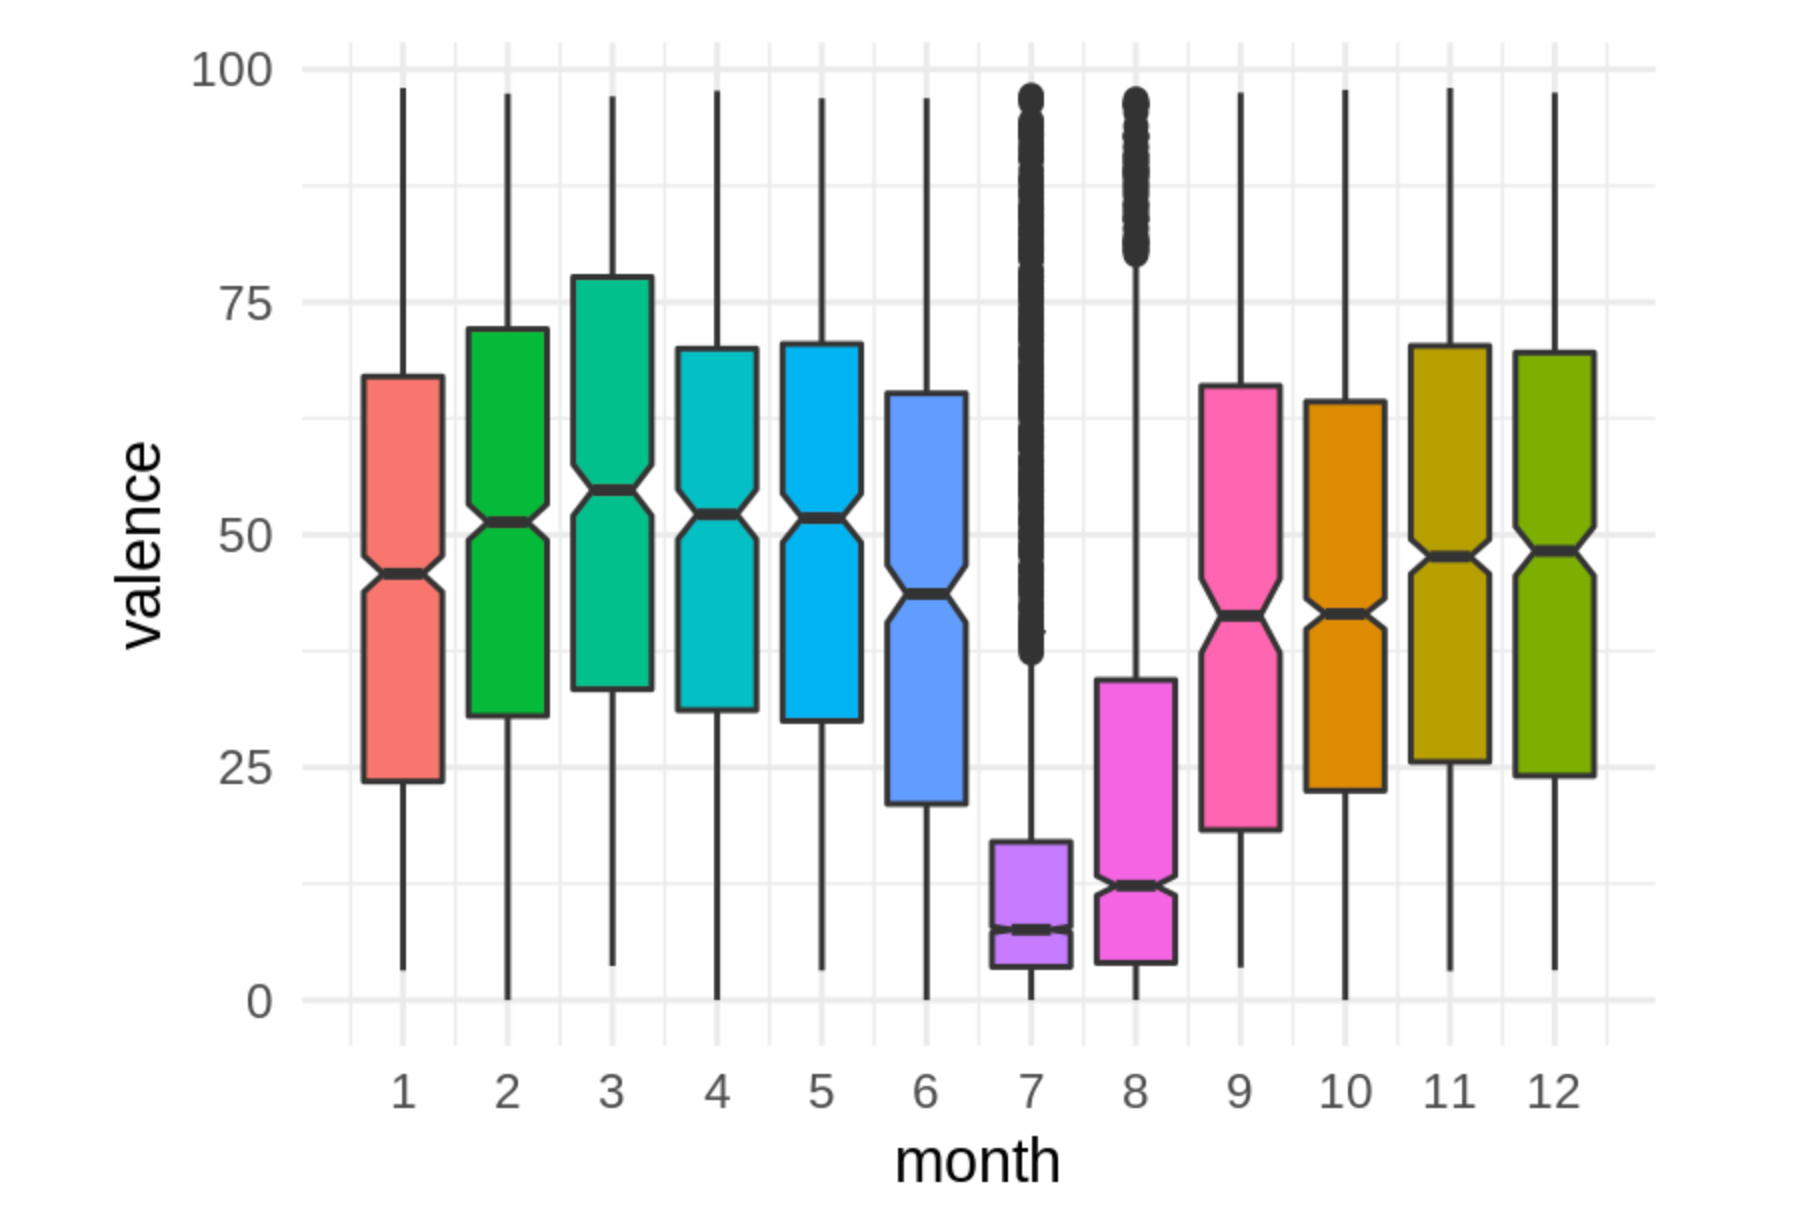
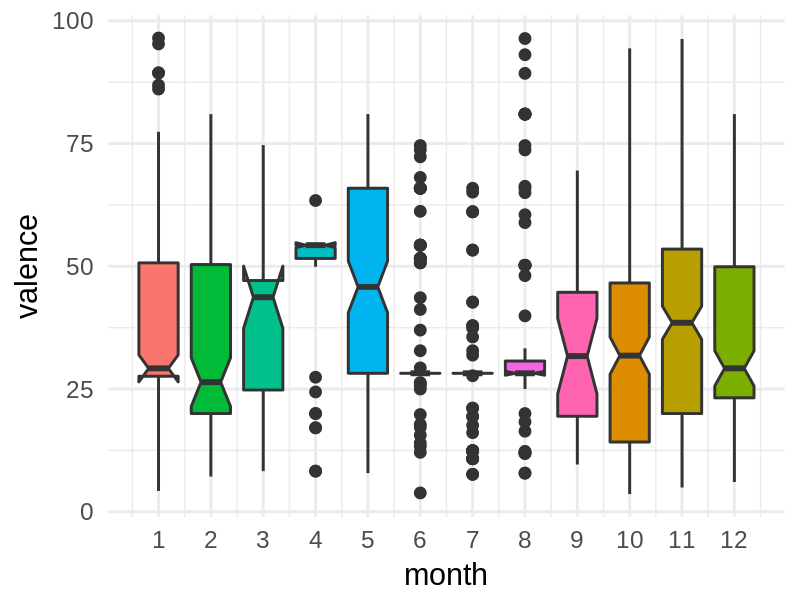
Below is a plot that shows the distribution of valence for each month as a boxplot:
The black bar in the center of each box gives the median value. Just looking at those we see that the seasonal effect described in the Economist doesn’t seem to hold for me, as July is one of the months with the lowest valence on average!
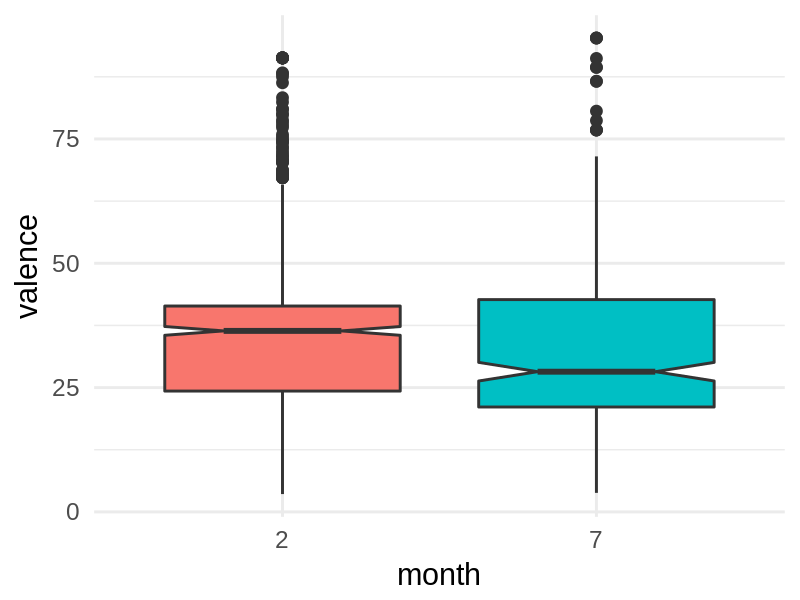
This effect becomes even clearer if you compare just February to July, as done in the Economist:
There’s a significant difference between February & July, with July’s median valence hovering just above 25, while it’s more like 38 for February! Indeed, this difference is even statistically significant.
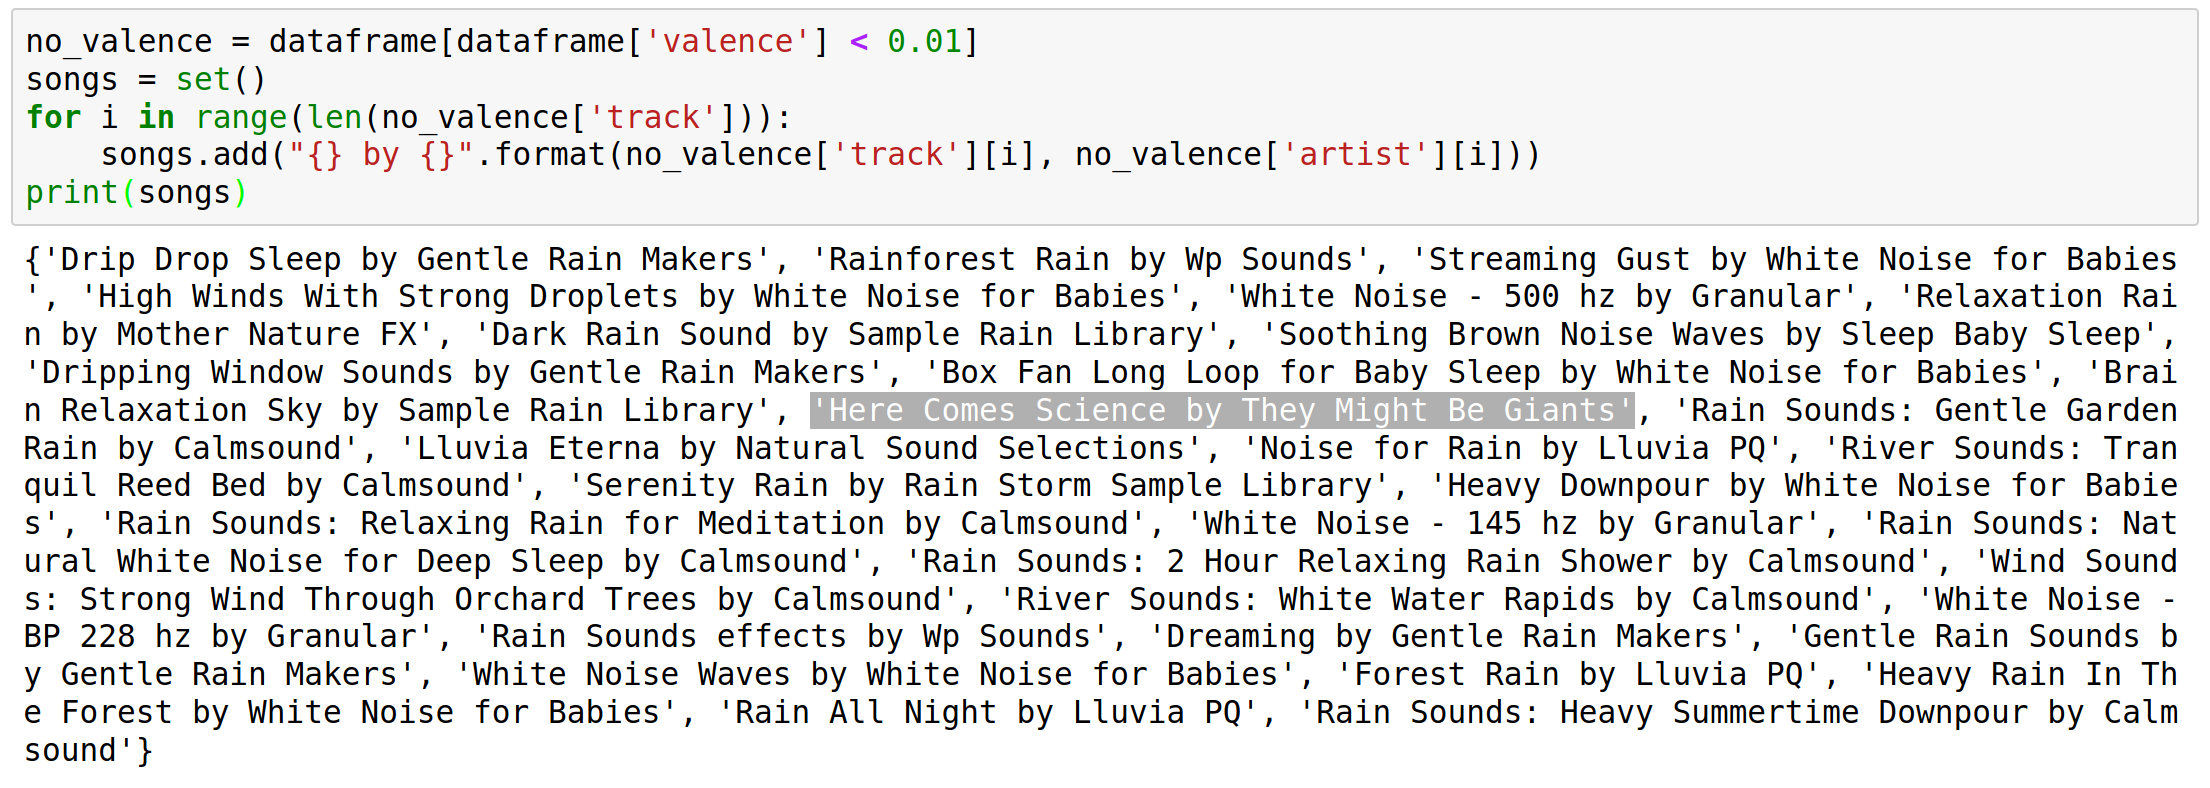
Hmm… Why are August and July the only two months in my data with outliers and why are the outliers in the opposite direction from the bars? Seems weird!
Did you maybe use Spotify to play non-music content? When @madprime used the notebook yesterday they saw some similar artifact and explained it with using Spotify for listening to white noise. I think Spotify’s mood classification algorithms have some issues when the content isn’t music and might default to a valence of zero for those cases.
This could explain your drops for July/August and also the ‘outliers’, which would be the actual music you listen too, while the boxes largely represent non-music?
I doubt that this would easily work, as it’s just as likely that your current mood influences your listening preferences, so even if Spotify tried to dump in mood-altering songs, you’re likely to skip them.
Yeah, my artifact was striking… The timing suggested the hypothesis of white noise – I had explored an extensive landscape of white noise to make our baby sleep.
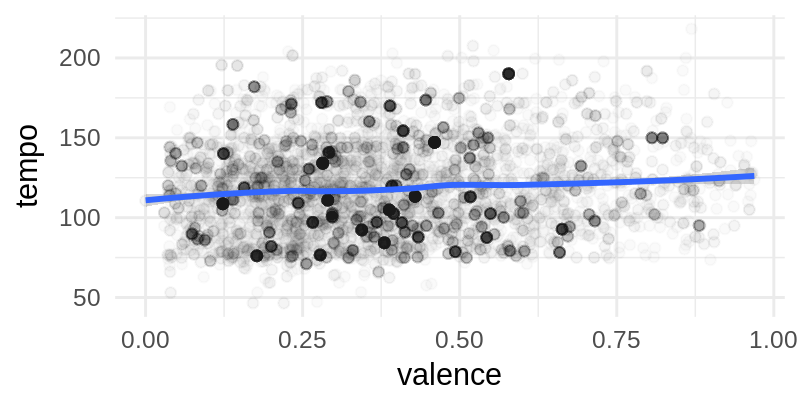
I told some folks at the CRI MakerLab yesterday about this analysis and they asked if there’s maybe just a clear correlation between the tempo of a song and the valence. Turns out that’s not the case, or at least not a straight-forward one!
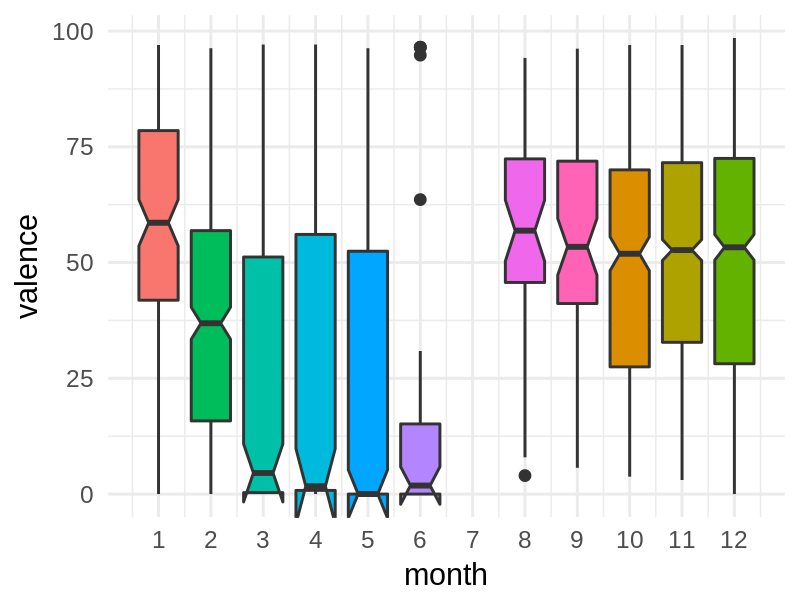
As the Economist also only used the most popular songs I tried to at least emulate this in a second step now, by filtering only for songs with a ‘popularity’ of >50, giving more or less my top 200 songs in terms of global popularity. But then the data basis becomes rather small, as seen in the box plots: